METEOROLOGICAL MAST
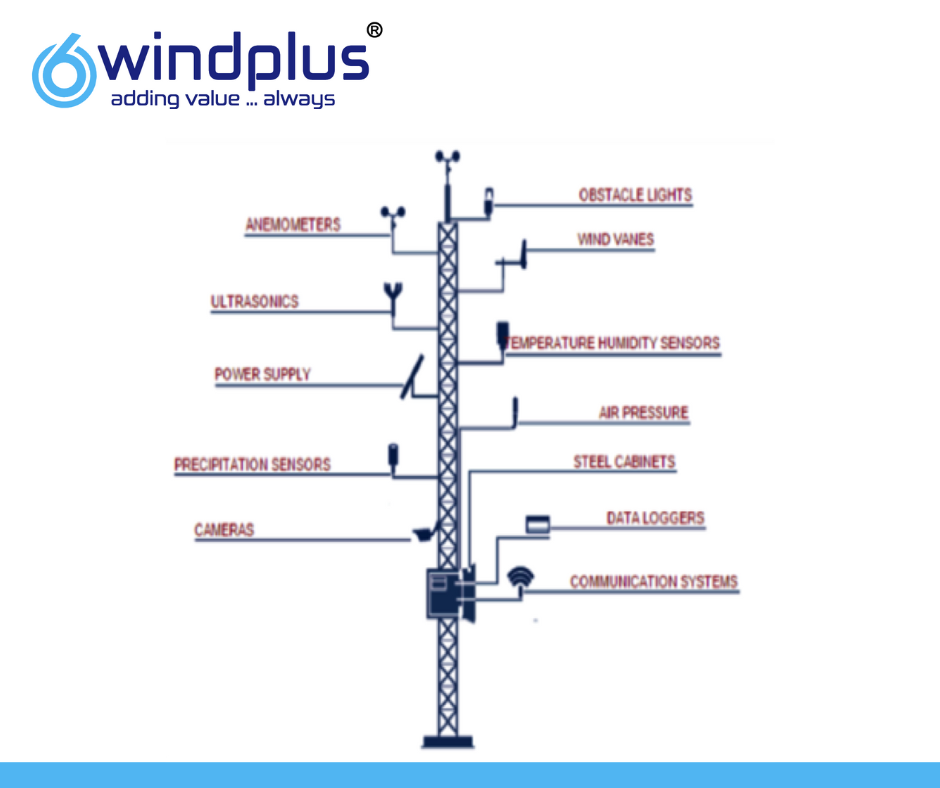
The met mast is a tower made of steel. Where the measuring equipment is installed. Ideally the met mast should be of the same height of the wind turbines that are going to be installed in the area however, to save money sometimes shorter masts are used. Before developers construct a wind farm, they first measure the wind resource on a prospective site by erecting temporary measurement towers named Meteorological mast known as Met masts.
Typically these mount anemometers at a range of heights up to the hub height of the proposed wind turbines, and log the wind speed data at frequent intervals. For atleast one year and preferably two or more. The data allow the developer to determine if the site is economically viable for a wind farm, and to choose wind turbines optimized for the local wind speed distribution.
Now a days met masts are evolutes as SODAR (sound detection and ranging), LIDAR (light detection and ranging). We can measure the data of nearly 10km surrounding using met masts. Now we see the details of instruments using in met masts. From met masts we can measure the Annual Energy Production (AEP).
AEP depends on the following three data
Wind Data
Terrain Data
Power Curve
1 . Wind Data
Instruments of Wind Resource Assessment
- Anemometer
- Wind vane
- Pressure
- Temperature
- Precipitation Sensor
- Solar Radiation
Sensor Name | Description | Unit | Range | Calibration |
Anemometer | It is used to measure the Wind Speed | m/s | 0 to 75 m/s | Each anemometer individually calibrated, calibration reports provided via electronic download |
Wind vane | It is used to measure the Wind Direction | ° | 0 to 360° | No Need |
Pressure | It is measure the atmospheric pressure on met masts | hpa | 600 to 1200 hpa | Each pressure individually calibrated, calibration reports provided via electronic download |
Temperature | It is measuring Operation Environment | °C | -40 to +40°C | Each temperature individually calibrated, calibration reports provided via electronic download |
Precipitation Sensor | It is used to notice the water drops or rainfall | mV | 0 to 5000mV | No Need |
Solar Radiation | Measure the Sun Irradiance value | W/m² | 0 to 2000 W/m² | No Need |
Table 1: Sensor Specification
a) Air Density
The kinetic energy content of the wind depends linearly on air density. The wind turbine power curve should also be adjusted according to site-specific air density.
Air density shall be derived from measurement of air temperature, air pressure.
𝜌 = p/RT kg/m^3
P- Average of pressure
T- Average of Temperature
R- Gas Constant (2.8705 x 10^6 erg (g K)-1)
Example 1:
A prospective wind park has an estimated annual mean pressure of 930 hpa and temperature of 28.4°C. What is the air density of the wind park?
Annual mean pressure- 930 hpa
Annual mean temperature- 28.4°C + 273.15
R- Gas constant (2.8705)
𝜌 = p/RT
=930/2.8705*301.55
=1.07 kg/m^3
b) Wind Power Density:
Wind power density (WPD) is defined as the flux of kinetic energy in the wind per unit cross-sectional area. Combining the site’s wind speed distribution with air density, it provides an indication of the wind energy production potential of the site.
WPD=1/2 mv^2
m- Air mass
v- Wind speed
The air mass m can be derived from the production of its density 𝜌 and volume V. The air mass passing through a normal section area of A during a time period of t at constant wind speed of v is
m = 𝜌V

Example 2:
A prospective wind park has an estimated annual mean wind speed of 6.51 m/s and air density of 1.08 kg/m3. What is the wind power density of the wind park?
WPD=1/2 𝜌v^3
=1/2 1.08*(6.51) ^3
=231.02 W∕m2
c) Wind Shear or Power Law Index (𝛼):
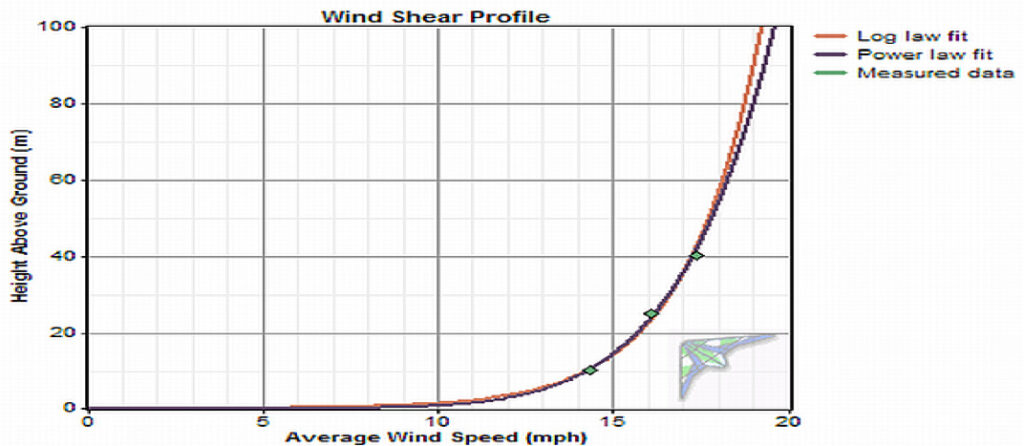
Change in wind speed with respect to height
Condition:
- Must two anemometer Sensors
- Same side anemometer sensor not calculated
Formula:
𝛼= log10(v1/v2)/ log10(z1/z2)
𝛼- Power Law Index
V1- Wind Speed measured at measurement Height Z1
V2- Wind Speed measured at measurement Height Z2
Z1-Measurement Height 1 above ground level
Z2- Measurement Height 1 above ground level
The wind shear exponent varies with the terrain. The following table provides reference values for wind shear exponent with respect to different types of terrain:
Terrain | Wind Shear Exponent |
Open Water | 0.10 |
Smooth, Level, Grass covered | 0.15 |
Low bushes with a few trees | 0.20 |
Row crops | 0.20 |
Heavy trees | 0.25 |
Several buildings | 0.25 |
Hilly mountainous terrain | 0.25 |

Example 3:
The annual mean wind speeds measured at 50m and 70m (meter above ground level) are 6.8 m/s and 7.3 m/s respectively. What is Power law index value?
𝛼= log10(v1/v2)/log10(z1/z2)
= log10(7.3/6.8)/log10(70/50)
𝛼= 0.21
d) Extrapolation:
To calculate the lower wind velocity to higher wind velocity
The extrapolation is required to estimate the wind speed at the wind turbine hub height when the wind speed is measured at a height different from the hub height.
Formula
v1= v2 (z1/z2) ^ 𝛼
v1- Mean wind speed at height z1
v2- Reference mean wind speed
z1- New height
z2- Reference height
𝛼- Wind shear exponent
Example 4:
The annual mean wind speeds measured at 70m (metre above ground level) are 7.3 m/s respectively. What is the mean wind speed at 80 m hub height? 𝛼=0.21
v1= v2 (z1/z2) ^ 𝛼
=7.3(80/70)^0.21
=7.5 m/s

e) Interpolation:
To calculate the higher wind velocity to lower wind velocity
v2 = v1 (z2/z1) ^ 𝛼
v2- Mean wind speed at height z2
v1- Reference mean wind speed
z1- Reference height
z2- New height
𝛼-Wind shear exponent
Example 5:
The annual mean wind speeds measured at 70m (metre above ground level) are 7.3 m/s respectively. What is the mean wind speed at 60 m hub height? 𝛼=0.21
v2 = v1 (z2/z1) ^ 𝛼
=7.3(60/70) ^0.21
= 7.07 m∕s
f) Data Recovery Rate
The data recovery rate is defined as the number of valid data records collected versus that possible over the reporting period and should be determined for each primary wind sensor (for all levels at each site).
Data recovery rate= Data records collected/Data records possible

Example 6:
The total possible number of ten-minute records in December is 4,464. If 264 records were deemed invalid. What is the Data recovery rate?
The number of valid data records collected would be 4200 (4,464 – 264)
Data Recovery Rate= (4,200/4,464)*100
=94 1%
g) Tower Shadow
Tower shadow effect is the alteration in uniform flow of wind due to the presence of the tower. For an upwind turbine, when the blade is directly in front
of the tower, it experiences minimum wind
h) Turbulence Intensity
Wind turbulence, defined as rapid fluctuations in wind speed and direction, can have a significant impact on turbine performance and loading. The most common indicator of turbulence is the standard deviation (σ) of the wind speed calculated from 2-second samples over the 10-minute recording period.
It determine the Flow structure of wind flow in terrain
Turbulence Intensity=σ/v
σ=Standard deviation of wind speed
v=Mean wind speed


