


Vector map is one of the inputs used to generate an annual energy production estimate of a wind farm. The map contains information about terrain elevation as well as roughness elements such as villages, water bodies and vegetation. One of the usual methods that is followed to create the vector map is using a combination of Google Earth(GE) – to identify & mark the roughness elements and Global Mapper(GM) – to generate elevation contours. This approach involves a considerable amount of manual work which could be time consuming, in case bigger boundaries need to be considered.
Hence, an alternate approach has been explored by Windplus to automate the process of vector map generation using an open-source software called QGIS. This method makes use of satellite imagery and open-source datasets to identify roughness elements and generate elevation contours through QGIS. The results are shared in a series of images below(Figures 1, 2 & 3) where a visual comparison of the final results is produced.
Fig 1. Overall Vector Map – QGIS(left) VS Google Earth + Global Mapper(right)
Fig 2. Roughness Elements – QGIS(left) VS Google Earth + Global Mapper(right)
Fig 3. Elevation Contours – QGIS(left) VS Google Earth + Global Mapper(right)
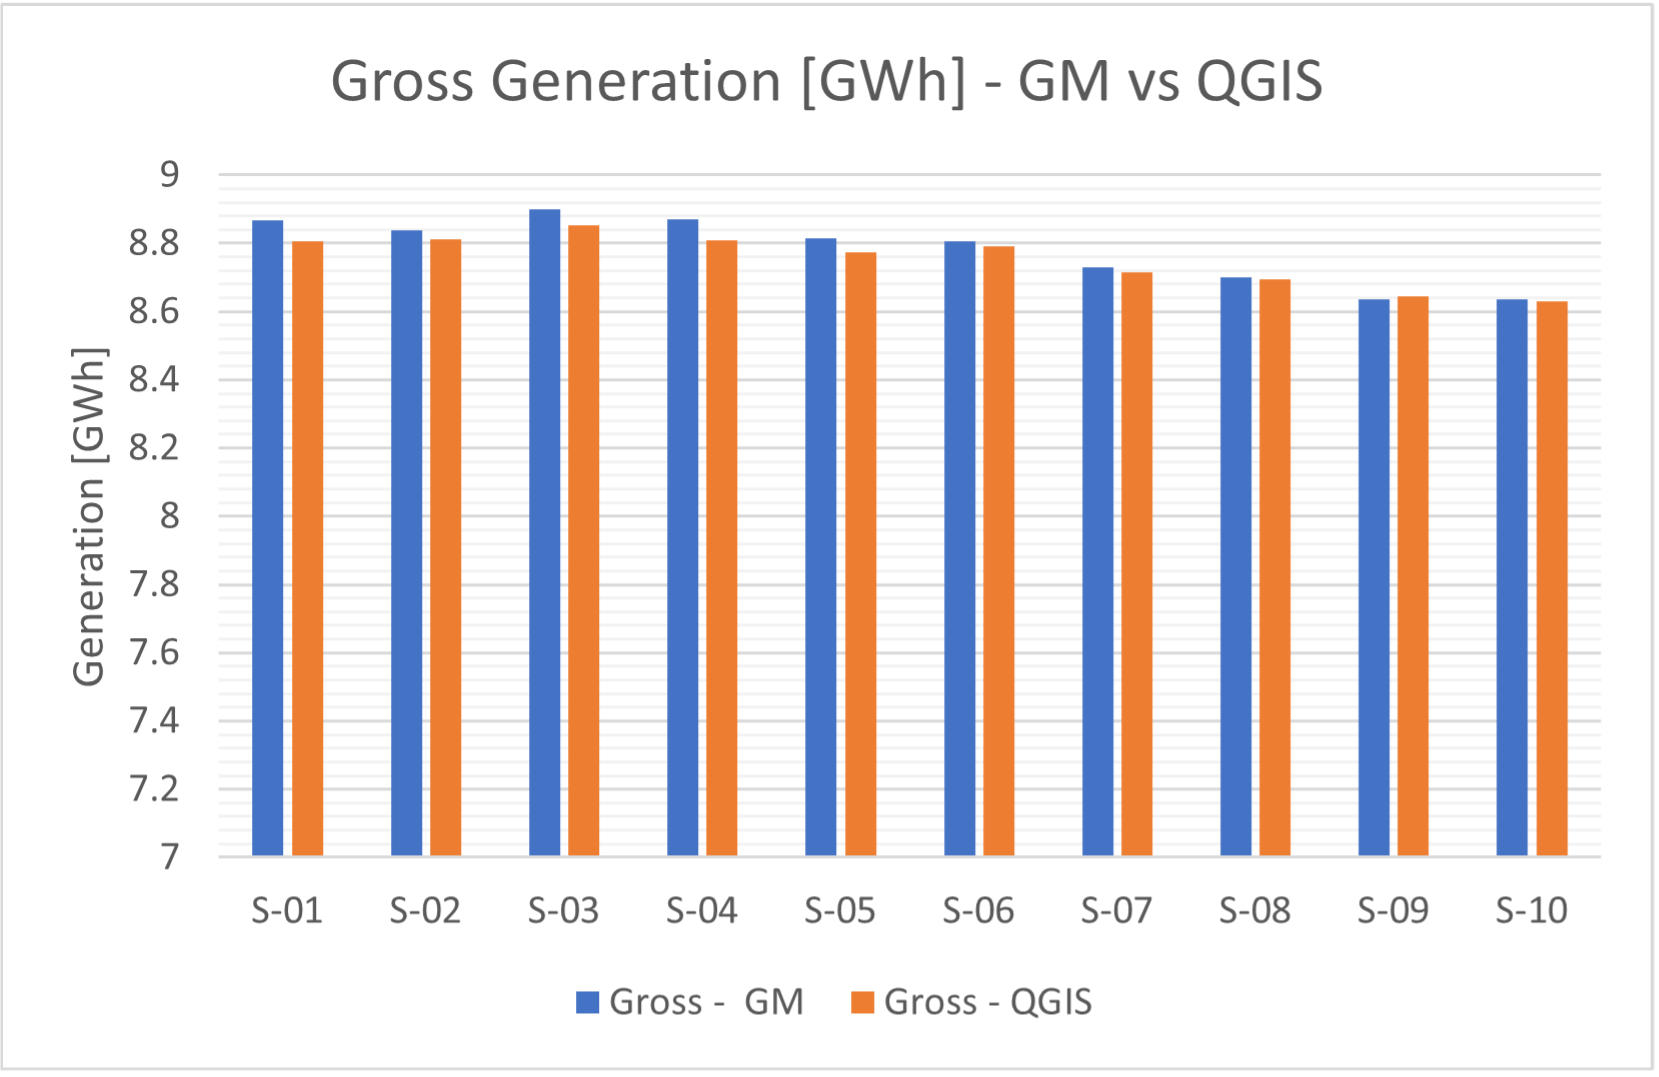
Fig.4 – Comparison of Gross Generation – QGIS vs Google Earth + Global Mapper
In order to quantify the effect of each of the above vector maps on the results, a validation method was identified where the gross generation of the wind farm was compared. Figure 4 above shows the wind farm generation on a per location basis and while there is a good match between the results achieved using both the methods, the minor variation in the values could possibly be due to a more detailed vector map in the case of QGIS since it is noticeable from Figures 2 and 3 that the QGIS method produces more dense contours and maps higher number of villages compared to the manual method.
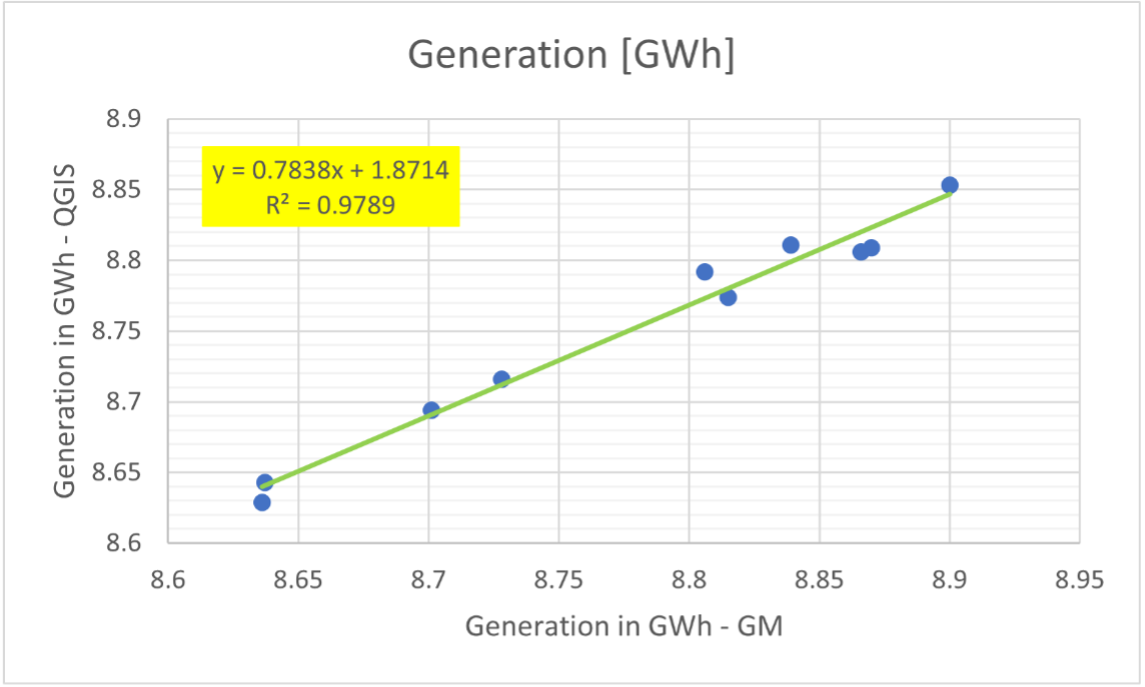
Fig 5. Linear Regression fit for generation
In order to understand the effect on accuracy, a simple linear regression fit was performed to further check the level of correlation between the results. A value of 0.98 and a Pearson correlation coefficient of 0.99 were obtained which suggest that the results from both methods have a strong positive linear relationship.
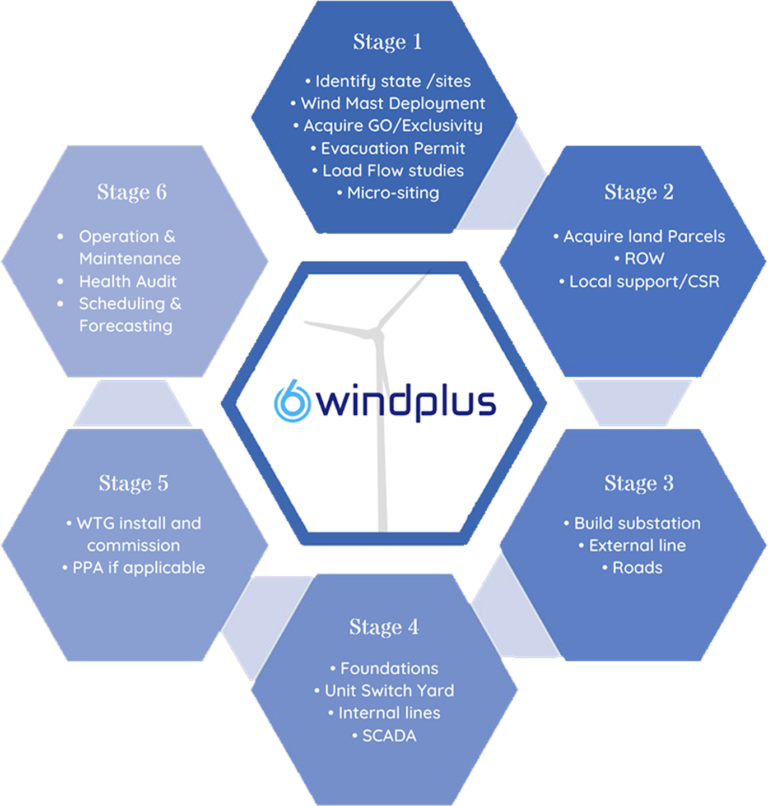
Windplus’s Mission is to provide World Class EPC of BOP(Balance of Plant) Services to the Renewable Energy Industry.
Through the six stages, influencing the global market to become a prominent & integral service provider of Renewable Energy.
Overview:
This module is designed to train engineering students from academic institutions. And in this module, we will cover all the fundamental information pertaining to the wind energy sector as shown below.
Topics Covered:
Introduction to wind energy.
Overview of wind turbine components.
Unit Substation.
Internal Lines and Pooling substation.
External Lines.
Installation and Commissioning.
Safety measures in wind projects.
Load Curtailment.
Operation and maintenance in wind farms.
Evaluation:
Evaluation should always be a part of training. So, as part of the evaluation process, we will conduct tests and assign projects to students at the end of each session. Also, certificates will be given to students at the end of the programme.
Takeaway:
Trainees will be introduced to the wind energy. Later on they will gain the knowledge about the energy conversion technique followed in the wind turbine. They are given a brief introduction on types of transformers and substations available and detailed knowledge about the electrical balance of plant.
Overview:
This module is designed to train employees and staffs from the Engineering Procurement and Construction industry. And in this module also, we will cover all the technical aspects related to wind energy sector in detail as shown below.
Topics Covered:
Basics of wind energy.
Wind Resource Assessment.
Balance of Plant – Electrical.
Balance of Plant – Civil.
Asset Management.
Commercial at a glance.
Evaluation:
Self-Assessment
Takeaway:
Trainees will be introduced to the wind energy. Later on they will gain the knowledge about the energy conversion technique followed in the wind turbine. They are given a brief introduction on balance of plant in which both electrical and civil are covered in detail. Then the technologies used for control of WTGs are explained. Commercials involved in wind power project and the performance analysis of WTG is explained in detailed.
Overview:
This module is designed to train employees and staffs from the Independent Power Producer industry. And in this module, we will cover all the technical aspects related to wind energy sector in detail as shown below.
Topics Covered:
Basics of wind energy.
Wind Resource Assessment.
Balance of Plant.
Wind turbine technology and control.
Costing at glance.
Plant Performance.
Evaluation:
Self-Assessment.
Takeaway:
Trainees will be introduced to the wind energy. Later on they will gain the knowledge about the energy conversion technique followed in the wind turbine. They are given a brief introduction on balance of plant in which both electrical and civil are covered in detail. Then the technologies used for control of WTGs are explained. Commercials involved in wind power project and the performance analysis of WTG is explained in detailed.

DIRECTOR – TRAINING & DEVELOPMENT WINDPLUS PVT LTD
Miss Mansi Yogesh Thakkar is a Leadership Trainer and a Professional speaker with 9 years of experience in training & development industry. She has completed BE.IT from Mumbai university. She is currently pursuing MA in leadership science from Chanakya International Institute of Leadership Studies , University of Mumbai.She is a dynamic young professional with training as a focal endeavor in contributing to people’s growth , personal development and organizational progress.
She is currently the Director : training & development in Windplus Pvt Ltd,Coimbatore and a Designated Partner at Mansi Thakkar Training Systems LLP , Mumbai
Her mission is to inspire all the entrepreneurs to become extraordinary leaders of tomorrow.

A Chartered Accountant by qualification, he has 30+ years cross-functional and multi-functional experience in various industries and various domains, primarily accounts, audit, commercials, legal, liaison, documentation and strategy. He is a co-promoter of Windplus and responsible for HR, IT &FINANCE functions in the company.
He has more than a decade of experience in the Windpower Industry, and was primarily instrumental in setting-up Powerica Ltd.’s Windpower Projects Development Div. which commissioned 50 MW capacity during his tenure and created a pipeline of 100 MW future capacity. He was responsible for Site Identification, Site Surveys, Land Acquisition (of govt. lands as well as private lands), acquisition of Right-Of-Way, liaison with Govt. Depts., supervising of Land Surveys, Logistic Surveys, and Power-Transmission Surveys, liaison with village-level local bodies, scrutiny of legal documentation, conceptualizing of CSR activities, liaison with OEMs and JV partners, and more. He was a member of the core-team for strategy and decision-making.
He is also a database-programmer and an Excel-guru (apart from indepth knowledge and experience in Systems Analysis and Design and Automation of manual processes), and therefore has contributed towards setting-up of IT infrastructure, systems and processes wherever he has worked.

Personal Profile:
I am in the part of Administerial work of the company. An energetic, ambitious person who has developed a mature and responsible approach to any task that undertake, or situation that am presented with. Excellent in working with others to achieve a certain objective on time and with excellence.
Strong analytic skills, used to form action plans for improvement. Enjoy challenges, problem-solving, engaging all levels of team members in improvements.
Expertise:
Employment History:
Academic Attainment:
Contact:
Phone: +91-7738356583
Email: rjk@windplus.in
Website: www.windplus.in
SF NO 1144 1B, 1A Ashoknagar, PHASE II, KALAPATTY
Coimbatore, Tamil Nadu 641048

I am passionate person when it comes to wind. A positive creative individual with a smile. To continue my career with an organization that will utilize my management, supervision & Administrative skills to benefit mutual growth and success.
Founder/Managing Director – Windplus Pvt Ltd. 2021 – Present
Sr.Vice President (Project – Wind Division) Powerica Ltd. 2016 – 2021
Executive Director, AWT Energy Pvt Ltd. / Asian Wind Tech 2005-2016
Deputy Manager – Customer Service, NEG Micon India Pvt Ltd (VESTAS). 2000-2005
Engineer – Operation & Maintenance, Windia Power Ltd (NEDWIND DK). 1995-2000
Phone: +91-7738386583
Email: windbaba@gmail.com / kmn@windplus.in
Website: www.windplus.in
SF NO 1144 1B, 1A Ashoknagar, PHASE II, KALAPATTY
Coimbatore, Tamil Nadu 641048


