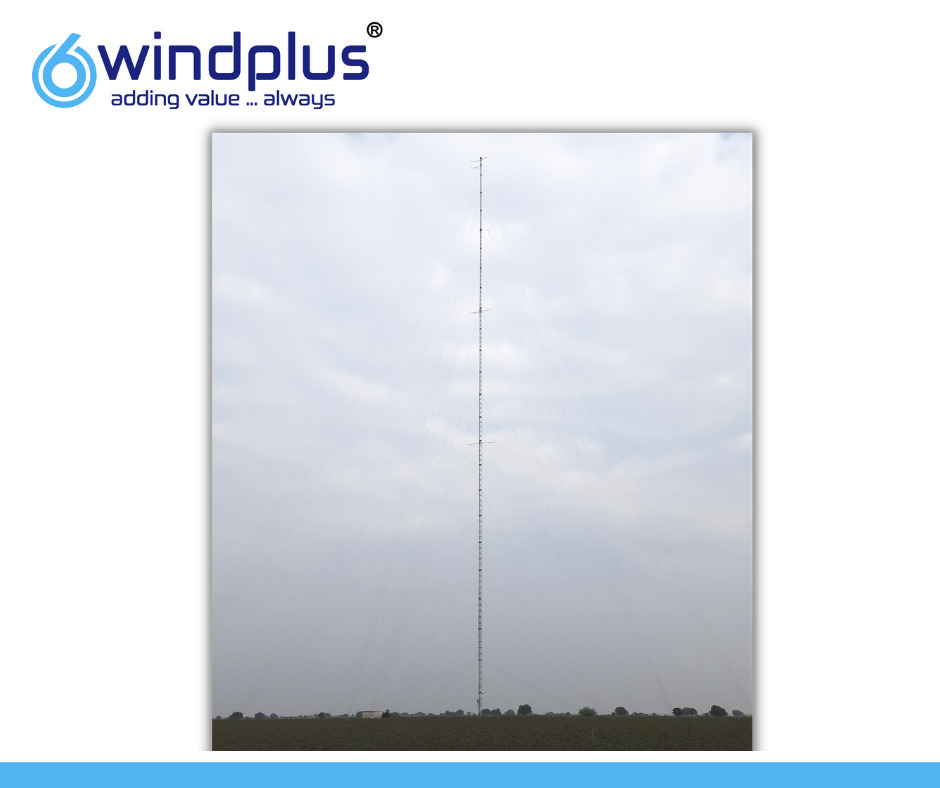
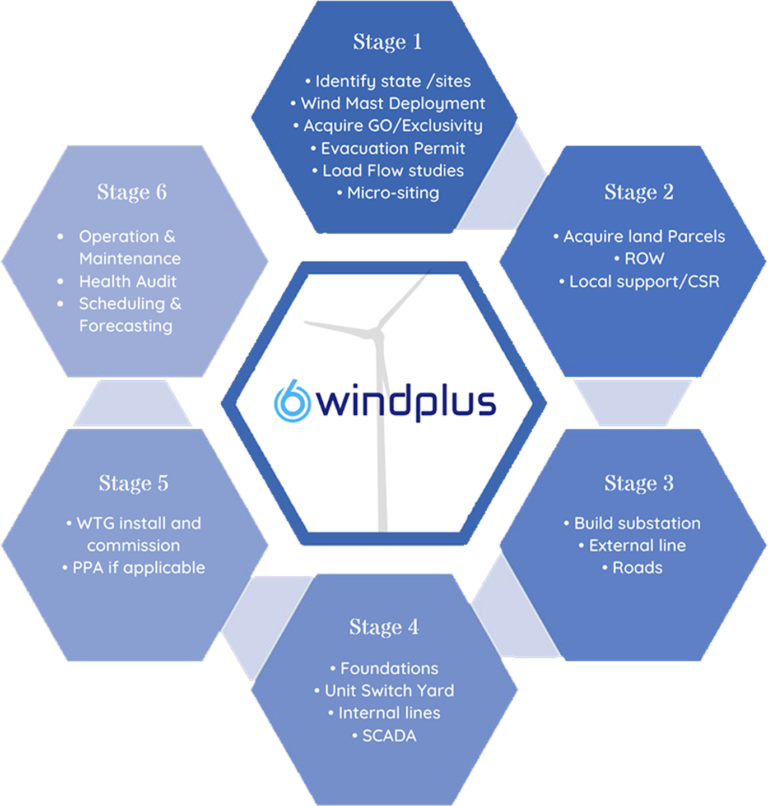
Wind Energy Projects will be designed based on the three important dimensions i.e., Wind, Land and Grid. Whereas, Wind plays a crucial role in any project before proceeding with Land and Grid. The Wind Monitoring Station (WMS) is erected for the purpose of conducting wind monitoring study of any particular region. The WMS is nothing but an elevated tower structure made up of steel, where the measuring instruments are getting installed. Minimum 1 year monitoring of wind climatic data is mandatory at any region where the WMS is getting installed to monitor the seasonal pattern of wind climates over the period of 12 months. Wind climatic data is the basic requirement for estimating the Annual Energy Production at certain region which will help the investor to make decision on the return on investment and project viability.
The main climatic parameters arrives from the wind monitoring Study are :
Wind Speed
Wind Direction
Temperature
Pressure
Humidity
Anemometer (Wind Speed):
Wind speed is the most important indicator of a site’s wind resource. Multiple redundant anemometers and measurement heights are therefore strongly encouraged to maximize data recovery and to accurately determine a site’s wind shear. A number of different units are used to indicate wind speed, including meters per second (m/s), kilometers per hour (km/h), miles per hour (mph), feet per second (ft/s) and knots (kt) whereas (m/s) is most commonly used one. Generally the Anemometer instrument will measure the wind speed range of 0 to 75m/s. Wind speed sensors are always at top most height of the Wind Met Mast following by after 20metre gap another wind speed sensors. Wind speed sensors are called as anemometer.

There are various types of Anemometers used to measure the wind speed, whereas for Wind Resource assessement mainly Cup Anemometer will be used. This instrument consists of a cup assembly (three or four cups) connected to a vertical rotating shaft. The wind causes the assembly to turn in a preferred direction. A transducer in the anemometer converts this rotational movement into an electrical signal, which is sent through a wire to the data logger. The logger measures frequency (or magnitude) of the signal and applies a predetermined multiplier (slope) and offset (intercept) to convert the signal to a wind speed.
Wind speed is the most important indicator of a site’s wind resource. Multiple redundant anemometers and measurement heights are therefore strongly encouraged to maximize data recovery and to accurately determine a site’s wind shear.
Wind Vane (Wind Direction):
Wind vanes are installed to determine the wind direction. A wind vane is best positioned just below the anemometers. It is recommended to install 2 or 3 additional wind vanes into the system. Wind direction measurements are a necessary ingredient for modelling the spatial distribution of the wind resource across a project area and for optimizing the layout of the wind turbines. A wind vane is usually used to measure wind direction. Accurate alignment of the wind vane shall be performed during its installation in order to allow for wind direction offset correction of the data.
In the most familiar type, a horizontal tail connected to a vertical shaft rotates to align with the wind. To define the wind direction with adequate redundancy, it is recommended that wind vanes to be installed on at least two monitoring levels. Ideally, they should not be mounted on the same booms or even at the same heights as the anemometers as they could interfere with obtaining accurate speed readings.

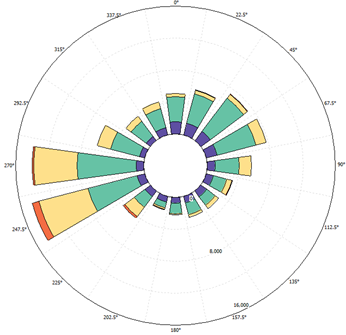
With the help of wind vane sensors we are able to make a Wind Rose which shows the prevailing wind direction annually or monthly. Later as per the prevailing Wind Direction micrositing of the wind turbine generator starts as per the given layout. The unit for Wind direction is degree (°). The unit range is 0 to 360°.
Temperature Sensor (Temperature):
Air temperature is an important characteristic of a wind farm’s operating environment. It is normally measured either 2m to 5m above ground level and near hub height, or both. Recommended uses of the data from this sensor include calculating energy density calculations; monitoring air temperature; calculating atmospheric stability conditions; identifying icing conditions in cold climates; and estimating PV panel efficiency, which is temperature dependent

On-site measurement of air temperature is generally recommended especially for sites where extreme temperature ranges are expected. Adequate shielding is mandatory in order to minimise biases and uncertainties due to solar radiation
Air temperature is used to estimate air density, which affects the calculation of power production. With the help of this we can also have the definite idea for the Wind Turbine Generator mechanical components working at specific temperature accordingly we can select the Wind turbine generator model.
Temperature and pressure also required to calculate the air density. The unit range is -42°C to 40°C. The unit for temperature is °C or K.
Barometric Sensor (Pressure):
Barometric pressure is used with air temperature to determine air density. Normal variations in pressure at the same temperature can affect air density by about 1%. Barometric pressure is difficult to measure accurately in windy environments because of the dynamic pressures induced when wind flows across an instrument enclosure. High-quality instruments are therefore quite expensive.
It is recommended to measure barometric air pressure on site and preferably close to hub height. If the air pressure sensor is not mounted close to the hub height, air pressure measurements shall be corrected to hub height. For projects at especially high elevations (such as greater than 2000 m above sea level) and with no nearby weather station at a similar altitude, it is recommended that high-accuracy air pressure measurements be made to decrease the uncertainty in air density. The unit of Pressure is mbar. The unit range is 600mb to 1200mb.
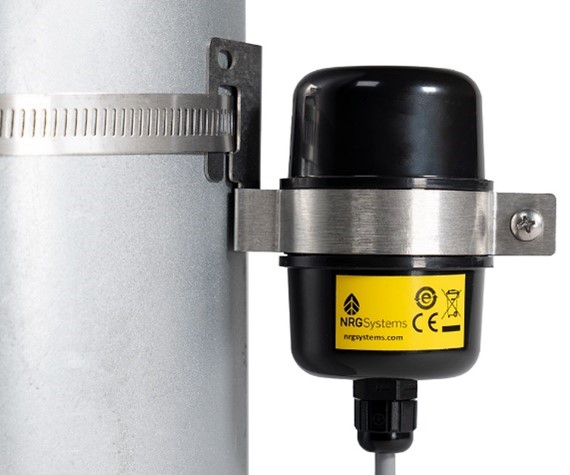
Several barometric pressure sensors, or barometers, are commercially available. Most models use a piezoelectric transducer that sends a DC voltage to a data logger, and may require an external power source.
Relative Humidity Sensor (Humidity):
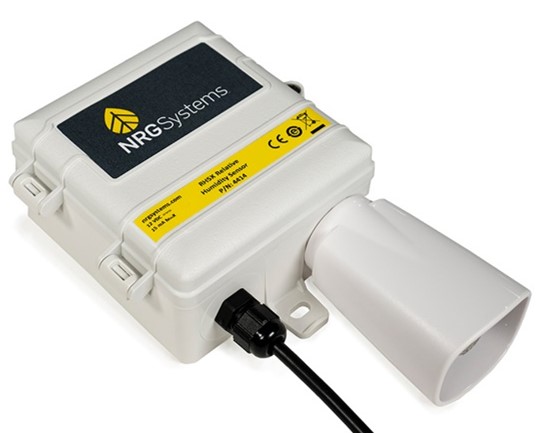
Onsite measurement of relative humidity is recommended at sites with high temperatures or extraordinary climate conditions. The humidity sensor shall be mounted within the upper 10m of the measurement mast.
The use of a relative humidity sensor can improve the accuracy of air density estimates. The addition of water vapour to air reduces its density; thereby decreasing the wind’s kinetic energy. Still, the potential influence of relative humidity on energy prediction is negligible.
Data Logger & Remote Data Transfer:
Data loggers store data locally, and many can transfer the data to another location through cellular modem or satellite link. All the climatic sensors installed with met mast structure will be connected to data logger through the cables. The data logger must be compatible with the sensor types employed and be able to support the desired number of sensors, measurement parameters, and sampling and recording intervals. It is prudent to mount the logger in a noncorrosive, water-tight, lockable enclosure to protect it and peripheral equipment from the environment and theft.
Every data logger contains a computer running on operating system software. It includes a small data buffer to temporarily hold data for processing. The computer accesses this buffer to calculate the desired parameters, such as Average, Standard Deviation, Minimum, Maximum and Gust. The resulting data values are then stored in memory. Data processing and storage methods vary according to the data logger.
Remote data transfer allows the user to obtain and inspect data without making frequent site visits and also to verify that the logger is operating correctly.

Remote transfer requires a telecommunications link between the data logger and the central computer. The main advantage of this method is that the data can be retrieved and inspected more frequently (e.g., Daily, Weekly, Monthly) than may be practical with site visits. This means that problems with the equipment can be more quickly identified and resolved, thus reducing data losses and improving data recovery.

